The Future on Margin
What breaks when the financing stops?

Last month I argued that AI can be early in adoption and already late as a trade. The response was consistent: OK, but what actually breaks? If the tech keeps working, adoption keeps climbing, and the earnings are real, what flips?
Bubbles are usually taught as morality plays. Greed. Gullibility. Mass delusion. True enough, but not very useful if you’re trying to see the next one coming. A better way to read them is as engineering diagrams. Booms form when two switches flip at once. They have been flipping for three centuries.
The first switch is a future you can picture. Not abstract optimism - something concrete. A continent connected by rail. Homes lit by electricity. Commerce rewired by the internet. A general-purpose technology that feels inevitable once you’ve seen the early version work.
The second switch is a financing regime that makes the future cheap to own today. Installments, margin, vendor credit, pyramids. Any scheme that lets you own a 30-year buildout with a 5 percent down payment, then forces cash out of you the moment refinancing stops.
I wrote about the first switch last time. This piece is about the second. Because what actually breaks isn’t belief in technology. It’s the specific credit pathway that lets investors own the future early. When that pathway closes, the technology keeps working, the balance sheet doesn’t.
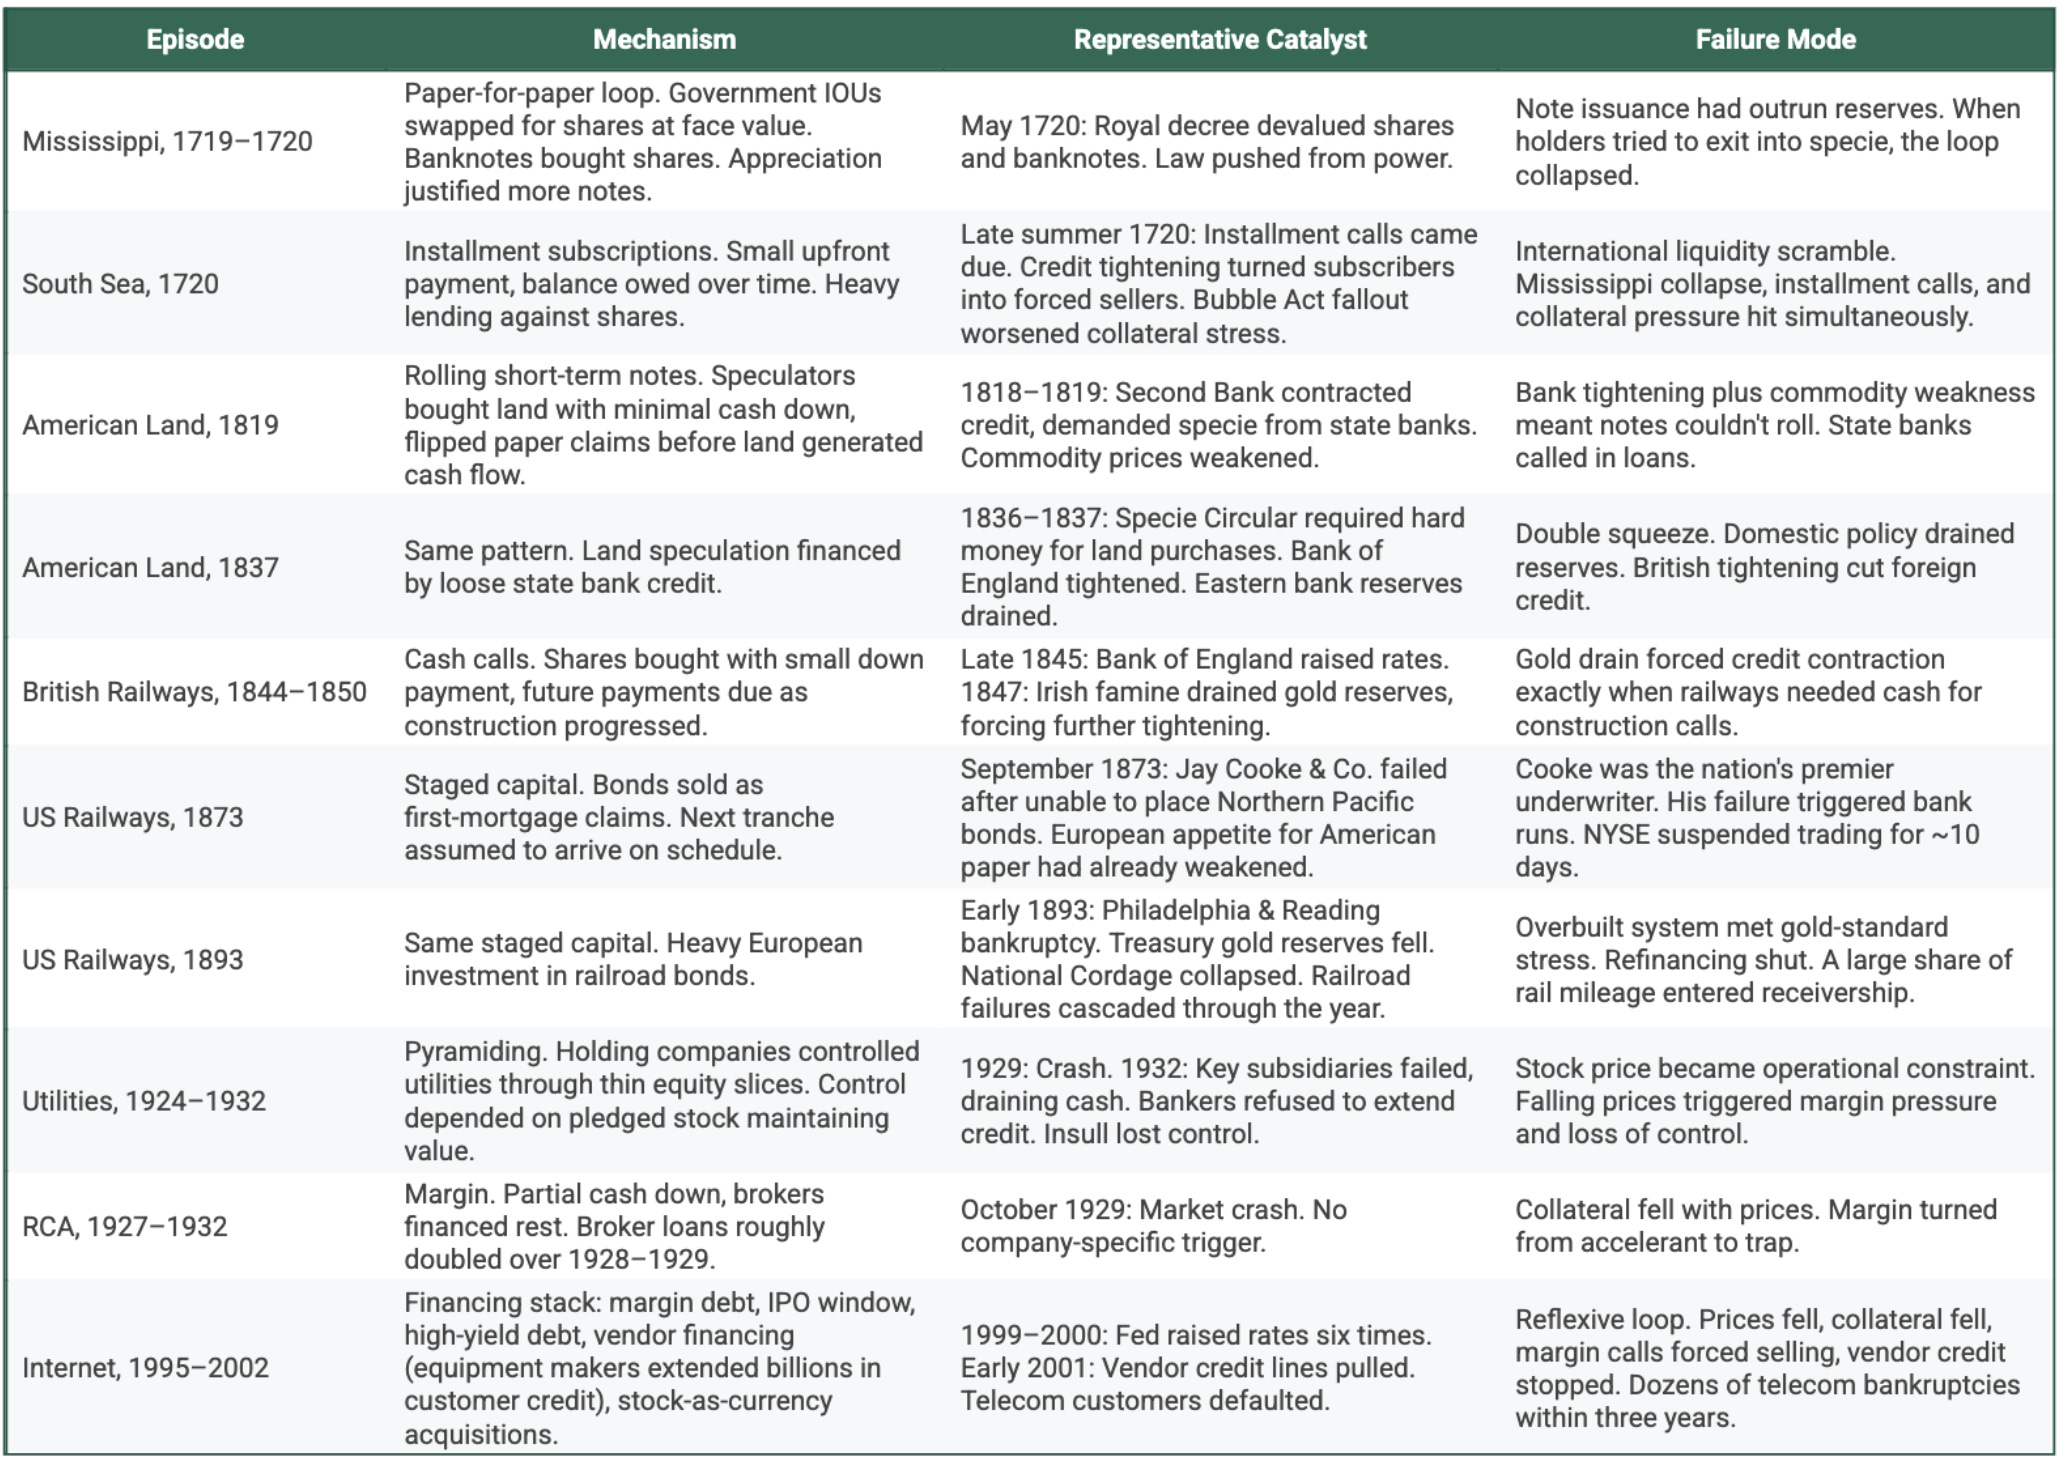
If you want the schematic version, there’s a table at the end: mechanism, catalyst, failure mode.
I. Paper for Paper: Mississippi Company, 1719 - 1720
The Mississippi scheme was a story where the French state outsourced public finance to John Law and told the market: this is now the machine. Louisiana was the future you could hang on the wall. Rivers, trade routes, mines, a whole continent of upside. But the real substance was fiscal. Buying Mississippi Company shares meant buying into a company that was absorbing government debt and consolidating government-like cash flows, with banknotes and state paper woven directly into the structure.
Shares were mass-market by design. You didn’t need hard cash if you could pay with government debt or bank paper. Holders of billets d’état, government IOUs trading at a steep discount, could swap them for shares at face value. The Banque Royale issued notes. Those notes bought shares. The shares appreciated. The appreciation justified more notes. It was a closed loop: paper for paper, with the state’s imprimatur making each step feel sound. Prices did what they always do when official meets easy financing: 500 livres in mid-1719 ran to 10,000 by late 1719.
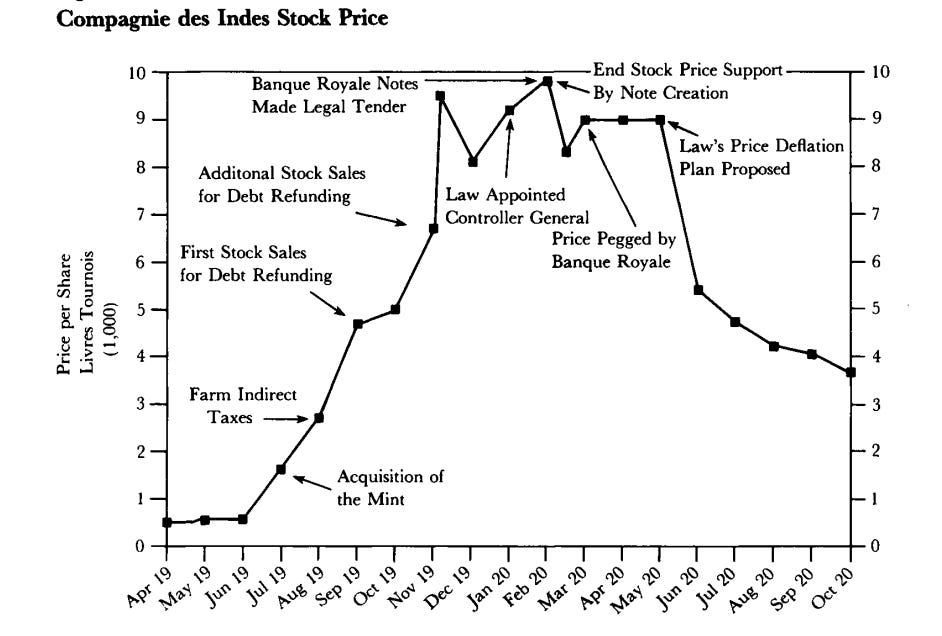
Then the stress test hit. Not because Louisiana wasn’t real, but because holders tried to turn paper profits into gold and silver. The system revealed what it actually was: confidence plus refinancing. Metallic payments were restricted. Banknotes were elevated to legal tender. Then came the decisive move: a share-price peg at 9,000 livres. The Banque Royale stepped in and exchanged its notes for company stock. Printing money to keep the price from falling.
Once you’re doing that, the price isn’t being discovered. It’s being defended. And defending it required repeated, massive note issues to absorb selling pressure. That showed up where it always shows up: higher prices in the real economy. Researchers estimate average monthly inflation around 4 percent from August 1719 to September 1720, with a 23 percent spike in January 1720.
When confidence cracked, the cleanup turned deflationary. Shares fell to 2,000 by September 1720, 1,000 by December, and back to 500 by 1721. Louisiana didn’t move. The future didn’t vanish. What broke was the financing regime. Mississippi was a paper-credit loop that only works as long as the balance sheet can keep refinancing exits.
II. Installment Subscriptions: South Sea, 1720
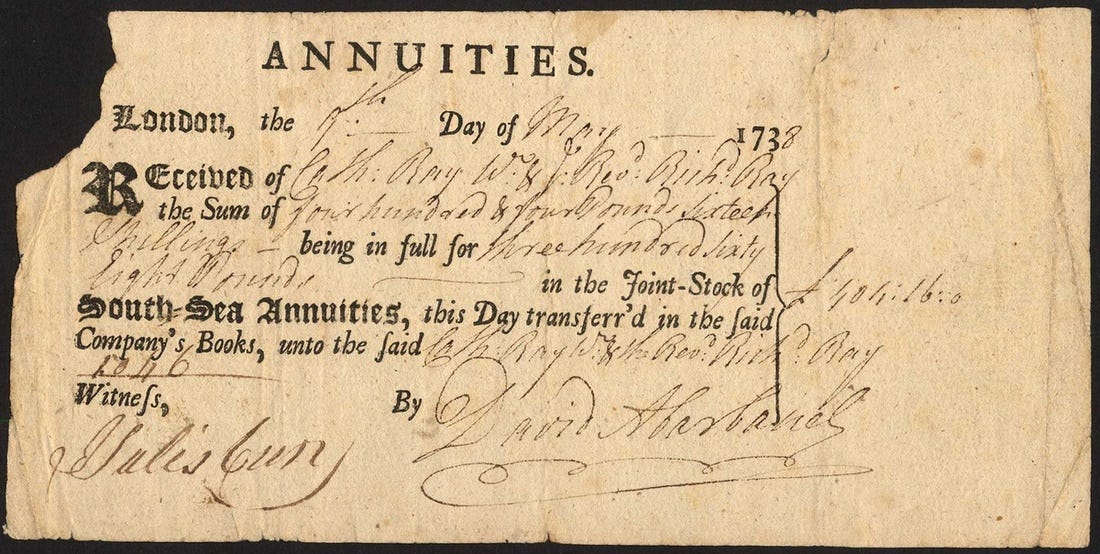
Britain ran the same play with less frontier fantasy and more explicit financial engineering. The South Sea story people remember is trade with South America. The story investors actually bought was refinancing the British state. After years of war, Britain was sitting on a messy stack of obligations: redeemable bonds, long annuities, short annuities. The South Sea Company offered to bundle that debt into a single corporate balance sheet. Consolidate public debt inside one company with Parliament’s blessing, lower the state’s funding costs, skim the spread, turn government liabilities into rising equity.
Parliament approved the plan in March 1720. Ministers and MPs owned shares. The political class was financially aligned, not just through equity but through loans secured against stock. And here was the leverage: investors didn’t need cash. Debt holders could swap government obligations for shares on attractive terms. New buyers could subscribe by paying a small amount upfront and owing the rest over time. That structure pulled demand forward and quietly embedded installment leverage across the system.
Shares traded around £120 in January. By summer they were running toward £700, peaking near £950. New subscriptions were sold at those levels with only a fraction paid down.
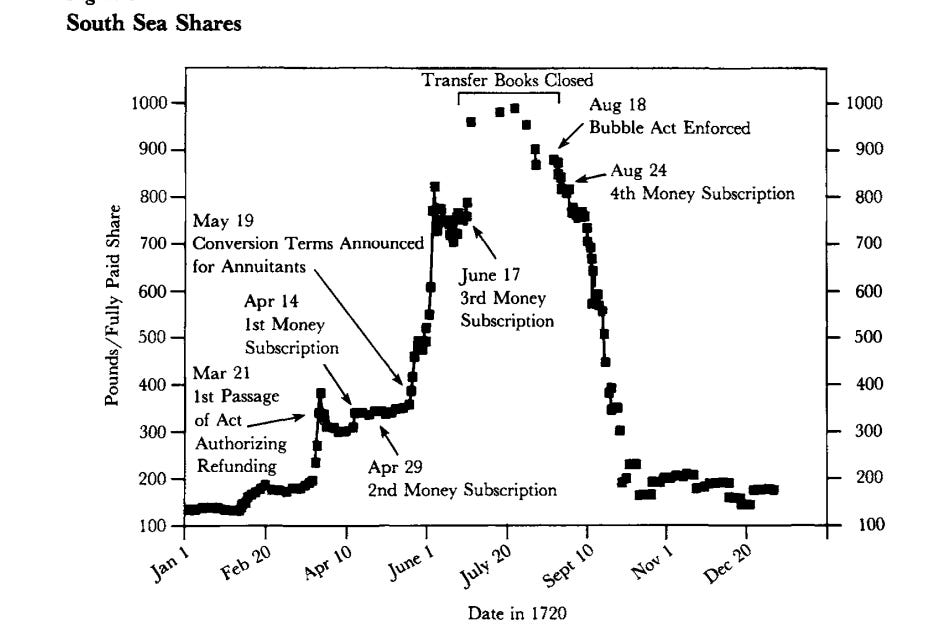
Then liquidity tightened. Britain didn’t stop being Britain. Public credit didn’t suddenly become worthless. What failed was the assumption that refinancing would always be available. When that window closed, installment buyers became forced sellers and loans against stock turned into margin calls. South Sea shares went from £775 at the end of August to £290 by early October. Isaac Newton sold early and took profits. Then bought back in near the top. "I can calculate the motion of heavenly bodies," he supposedly said, "but not the madness of people."
III. Rolling the Note: American Land, 1790s - 1830s
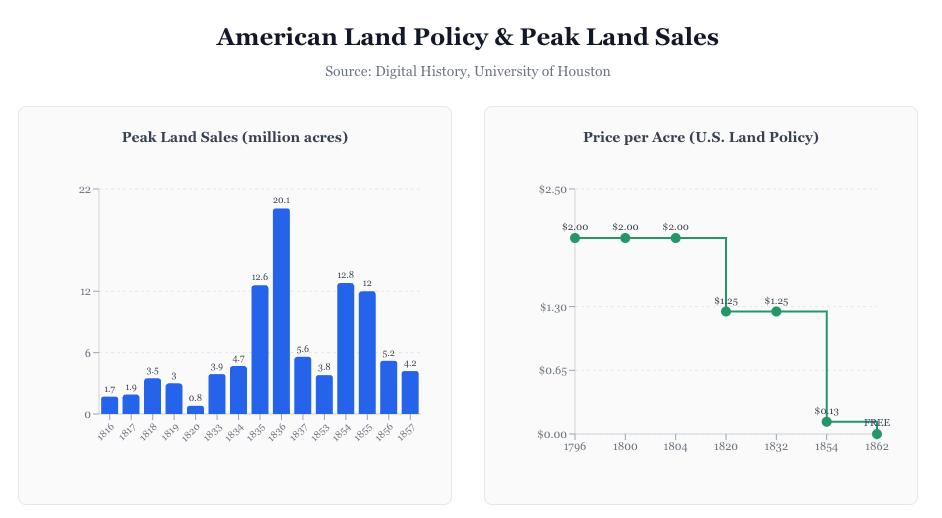
Early American frontier land speculation is the same psychology stretched across decades instead of months, and in some ways it’s the purest version because the “future” is so easy to believe. The asset wasn’t a chartered company with opaque accounts. It was land: surveyed, titled, mapped, subdivided, and wrapped in a national story that mostly ran in one direction. Population growth, westward settlement, canals, then railroads, rising agricultural output. The belief was: “This will be worth more, and I can carry it until then.”
Speculators bought large tracts with minimal cash down, used short-term notes and bank loans to hold them, then subdivided and sold parcels, often flipping paper claims several times before a place generated real cash flow. As long as prices rose, the interest looked manageable and the leverage felt prudent. The whole system rested on one assumption: that you could always refinance patience, roll the debt, find the next buyer, extend the bridge one more season.
The unwind, as always, only required credit tightening. The triggers varied: in 1819, the Second Bank of the United States called in loans and demanded specie from state banks that had been lending freely against land; in 1837, Andrew Jackson’s Specie Circular required payment for government land in gold and silver instead of paper, just as the Bank of England was raising rates and pulling credit from American borrowers. When banks pulled back, buyers disappeared, and notes couldn’t be rolled, the “inevitable future” stopped being reassuring and became a liability.
One detail I find impossible to shake is Meriwether Lewis, who led the expedition that mapped the West, understood exactly what it was and how long development would take. And yet he died insolvent in 1809, caught in land speculation and government debt, despite being granted land himself. The future he believed in did arrive. The land did become more valuable. The country did expand exactly as envisioned. It just didn’t happen on the timeline his balance sheet required. Being right about the future doesn’t protect you if you finance it too early.
IV. Staged Capital: Railways, 1844 - 1908
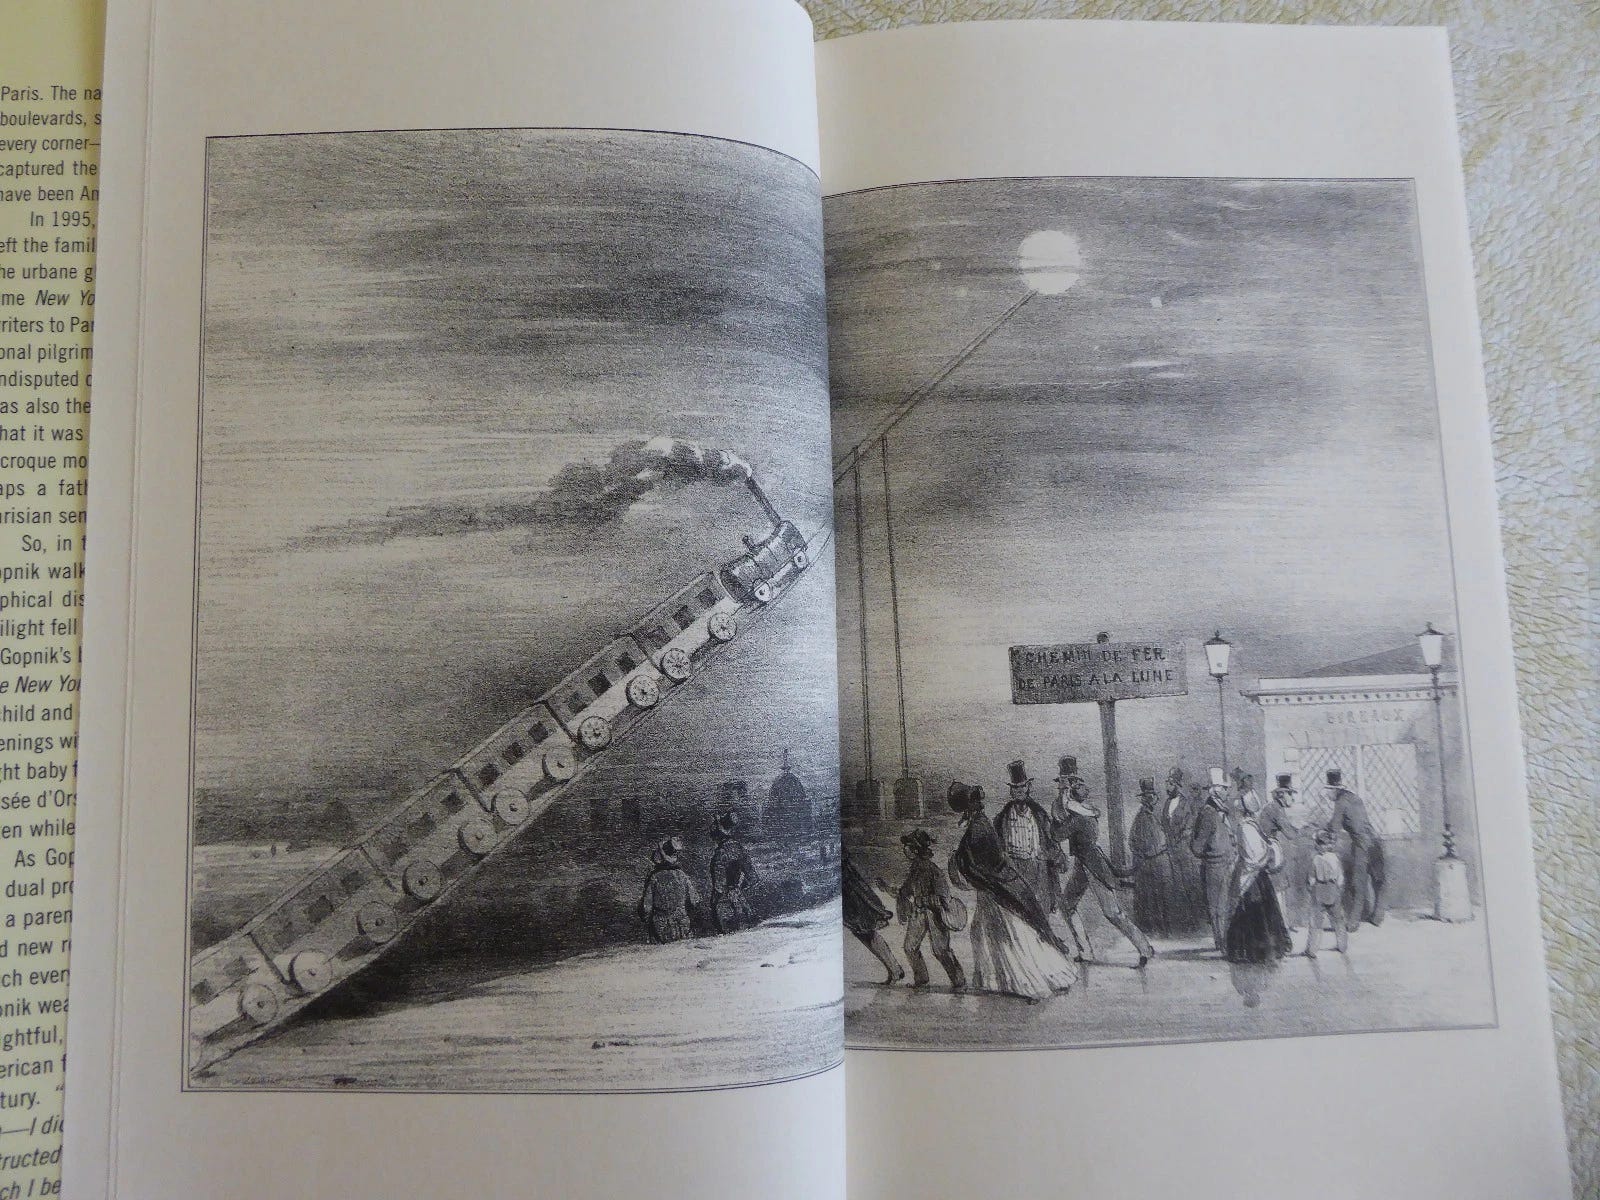
I read an essay collection called Paris to the Moon years ago and filed that image away as peak French whimsy. Modernity, optimism, all of it. Only later did it click. The train-to-the-moon cartoon wasn’t romanticism. It was satire about British railway stock mania, about how easily we price the destination before the tracks exist, and how normal it feels from the inside.
Britain, 1844 - 1850
By the early 1840s, rail already worked. Locomotives weren’t a parlor trick. But Britain wasn’t yet a finished train nation, and that gap created the perfect story: network effects, time compression, cheaper freight, compounding commerce. It also created the perfect pitch. Buy the future now.
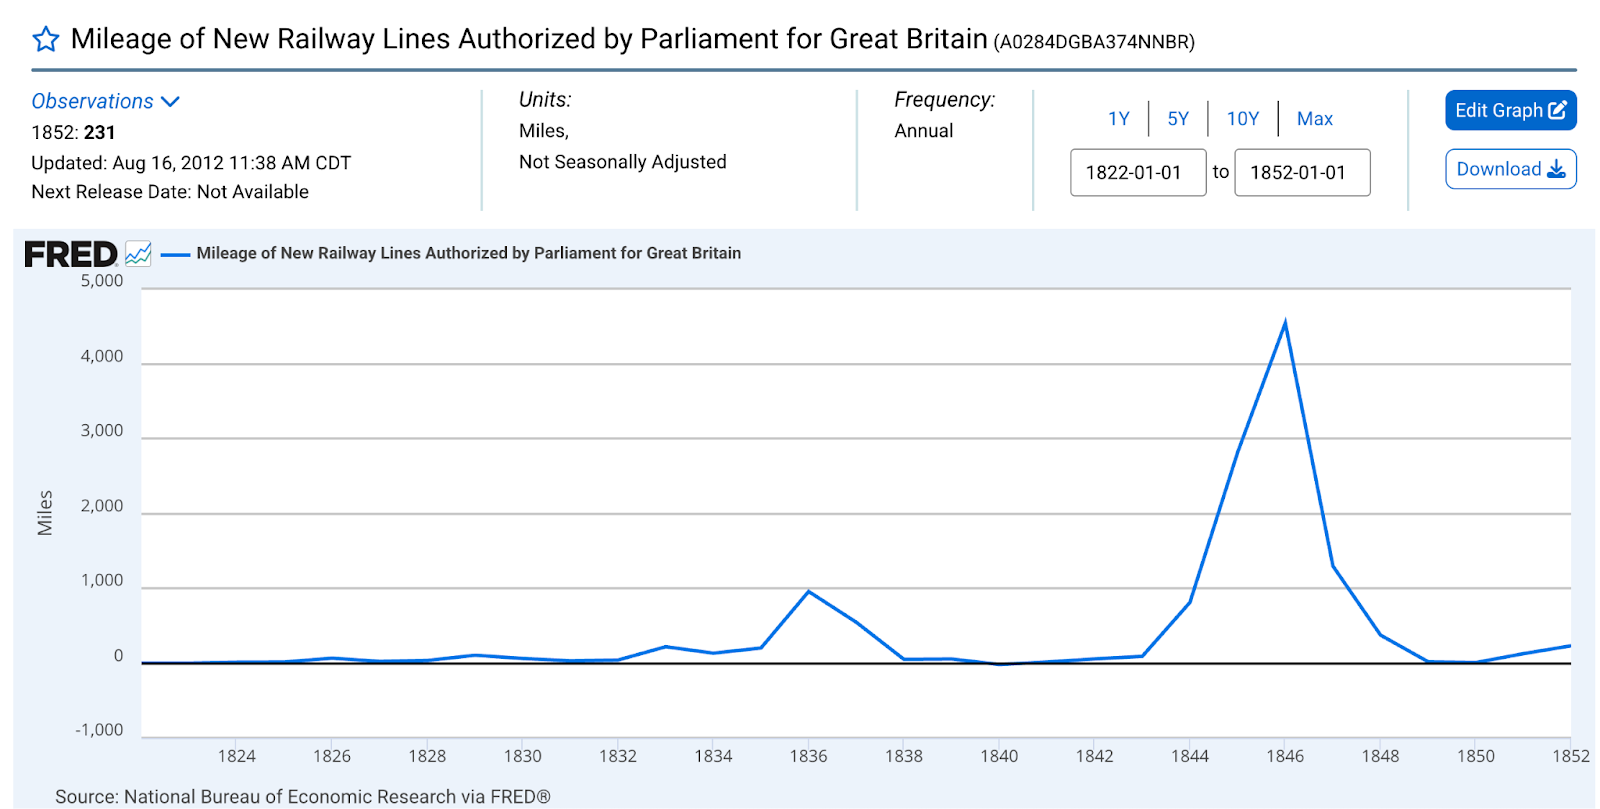
The cleanest chart of mania isn’t a stock chart. It’s Parliament. In 1844, lawmakers authorized 805 miles of new railway. The next year: 2,816 miles. Then 1846 hit. Parliament passed 272 Acts, sanctioned 4,540 miles, and entertained proposed routes totaling 9,500 miles. Railway capital formation consumed nearly 7 percent of GDP, possibly closer to 8. That’s not infrastructure policy. That’s a financing window thrown wide open.
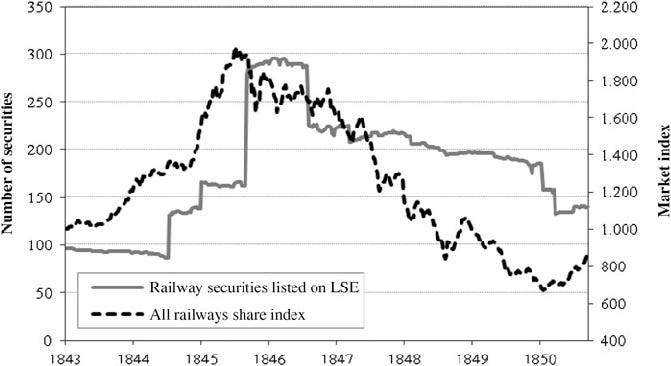
Then it slammed shut. By 1848, Parliament authorized just 330 miles. The railway share index, which had peaked at 167 in mid-1845, cratered to 80 by October 1848. Of the 9,800 miles authorized between 1844 and 1850, some 3,760 miles were abandoned outright. Thirty-eight percent of the network had only ever existed on paper.
What made the boom executable wasn’t excitement. It was structure. Railway equity was designed to be bought on small upfront cash with future installments. You could control significant exposure with limited money down and trade in the promise of paying later. As promotion hit full fever, the market did the most dangerous thing it can do in a capital-intensive industry: it confused maps for funding.
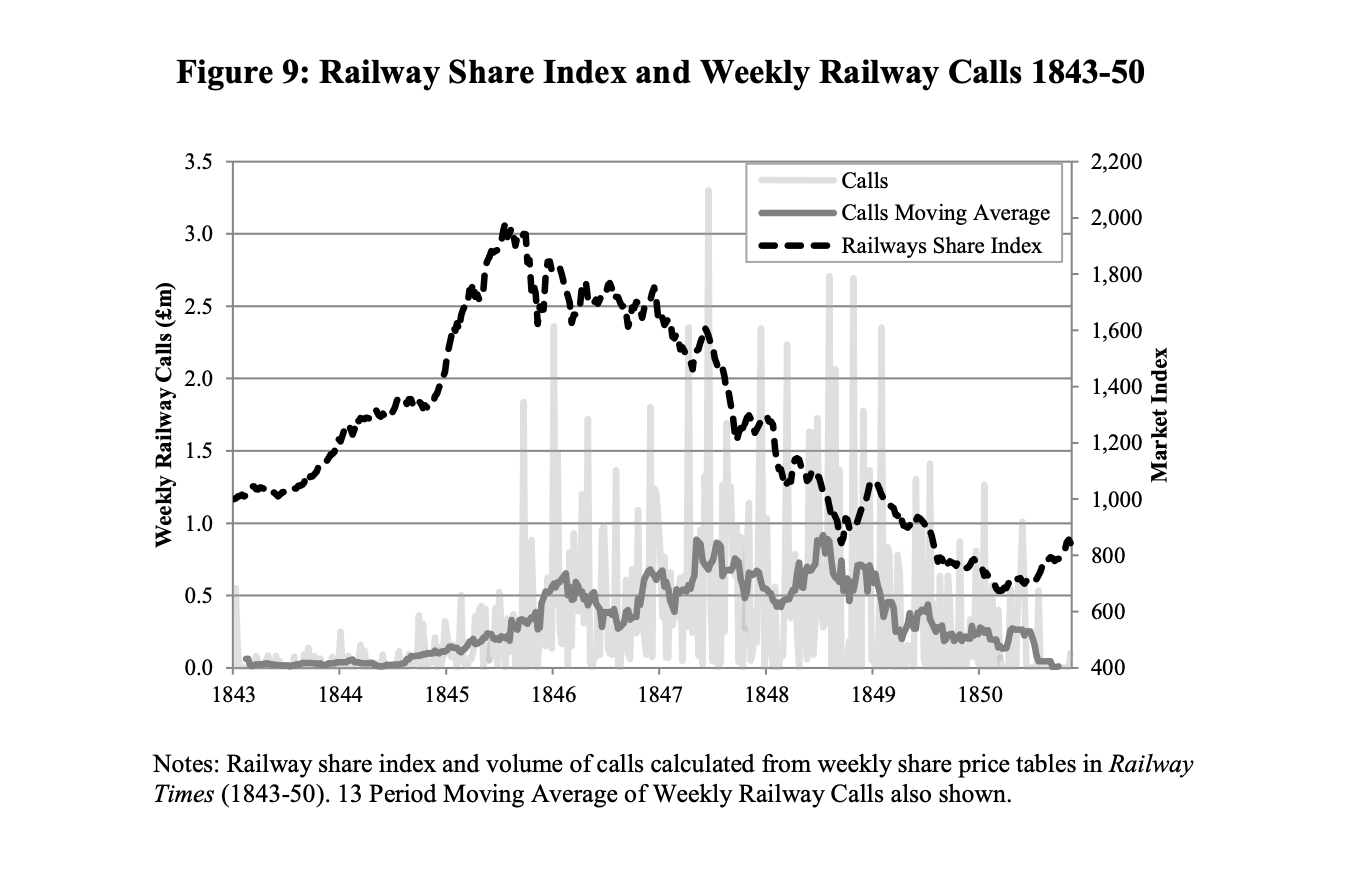
The part people miss is how the bust actually feels. The market doesn’t need to change its mind about railroads. It just needs to stop financing every railroad at once. That’s where calls come in. The industry’s weekly cash demands rise as projects move from prospectus to shovel. Suddenly “owning the future” turns into “please wire money by Friday.”
The tightening catalyst was the usual blend: higher rates, weaker liquidity, a broader credit wobble. 1847 was a classic stress point in British credit conditions. Once the marginal buyer disappeared, the entire installment-and-new-issue ecosystem stopped working. Campbell’s railway share index fell 66 to 70 percent from peak to trough.
United States, 1870s - 1900s
America didn’t have one clean railroad blow-off. It had a buildout that lasted decades, and a market that treated each financing window like a new era.
The cycle shows up in the bluntest metric: miles of track laid. After the Civil War, construction surged, then snapped when the first credit regime broke. Track miles fell from 7,139 in 1872 to 4,623 in 1873, then to 1,524 by 1877. The Panic of 1873 wasn’t a story about railroads stopping. It was a railroad-finance story with a bank run attached. Bonds had been sold hard. Refinancing suddenly wasn’t there. Jay Cooke & Co., the key underwriter behind Northern Pacific, failed. Investors rewrote the definition of “safe” in real time.
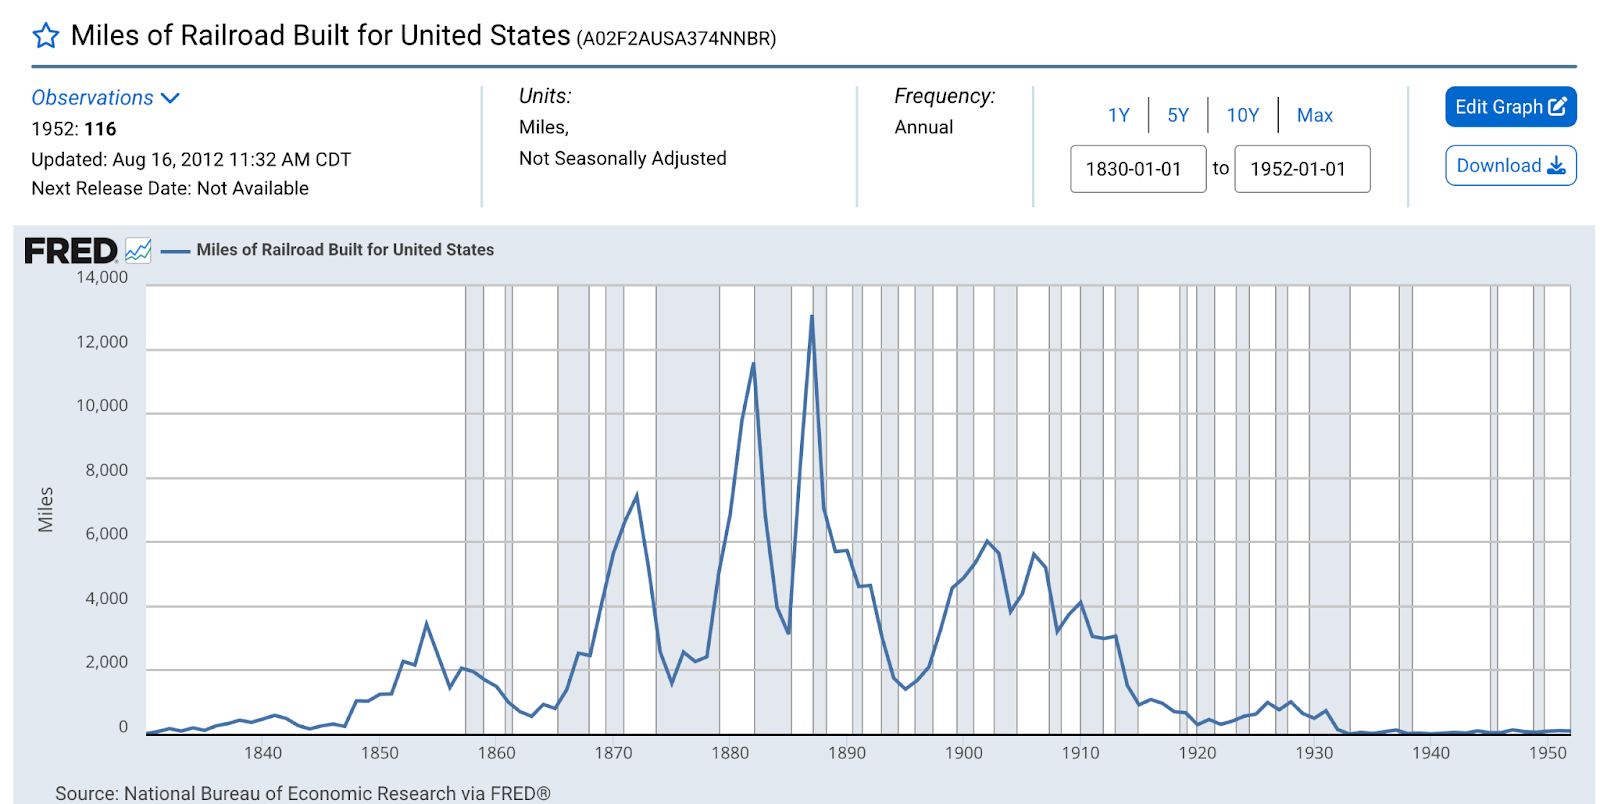
Then came the second wave. Track laying went vertical again: 11,569 miles in 1882, peaking near 12,983 in 1887. The narrative was obvious and true. A continental grid that turned distance into time, pulled towns into existence, turned prairie into export revenue. But railroads were also a capital-markets product. Promoters drew routes on paper. Local boosters fought to get on the line. Wall Street and London packaged the dream into securities you could buy at scale.
Bonds were marketed as safe, framed as first-mortgage claims on physical assets. Equity was the levered upside on national progress. Because these projects were long-duration and cash-hungry, the structure evolved the way it always does: stacked capital, staged funding, and an unstated assumption that the next tranche would show up on schedule.
What eventually broke wasn’t the idea of rail. It was the belief that the bridge between financing and revenue could always be rolled. Railroads burned cash up front and earned it back slowly. Coupons and short-term notes ran on a calendar. Once investors stopped treating railroad paper like a quasi-sovereign claim on America’s destiny, “unlimited capex” collapsed into a single question: who is writing the check?
By the early 1890s, hesitation had plenty of fuel. Saturation. Rate wars. A system that had been over-capitalized. You didn’t need every line to be a fraud. You just needed enough marginal projects to be weak, and enough leverage to be unforgiving, once the new-issue window narrowed. The Panic of 1893 did the rest. The hangover was measurable: 40,819 miles in receivership in 1894, rising to 87,856 miles in 1895.
The third wave, in the early 1900s, looked more mature but obeyed the same law. Construction stayed positive: 4,484 miles in 1906, 3,824 in 1907. Then it dropped to 1,801 in 1908.
Here’s the point that gets lost in the morality-play version of bubbles. The underlying business kept improving. U.S. railroad gross earnings rose steadily, from roughly $7.3 million per month in January 1870 to $114.8 million per month by January 1914. A 16-fold increase. Roughly 6.5 percent annual growth over almost half a century.
The stocks didn’t track that arc. They went through at least six distinct boom-bust cycles over the same span. The market wasn’t pricing whether freight moved. It was pricing financing conditions: credit availability, refinancing risk, whether the next risk-off shock could be survived.
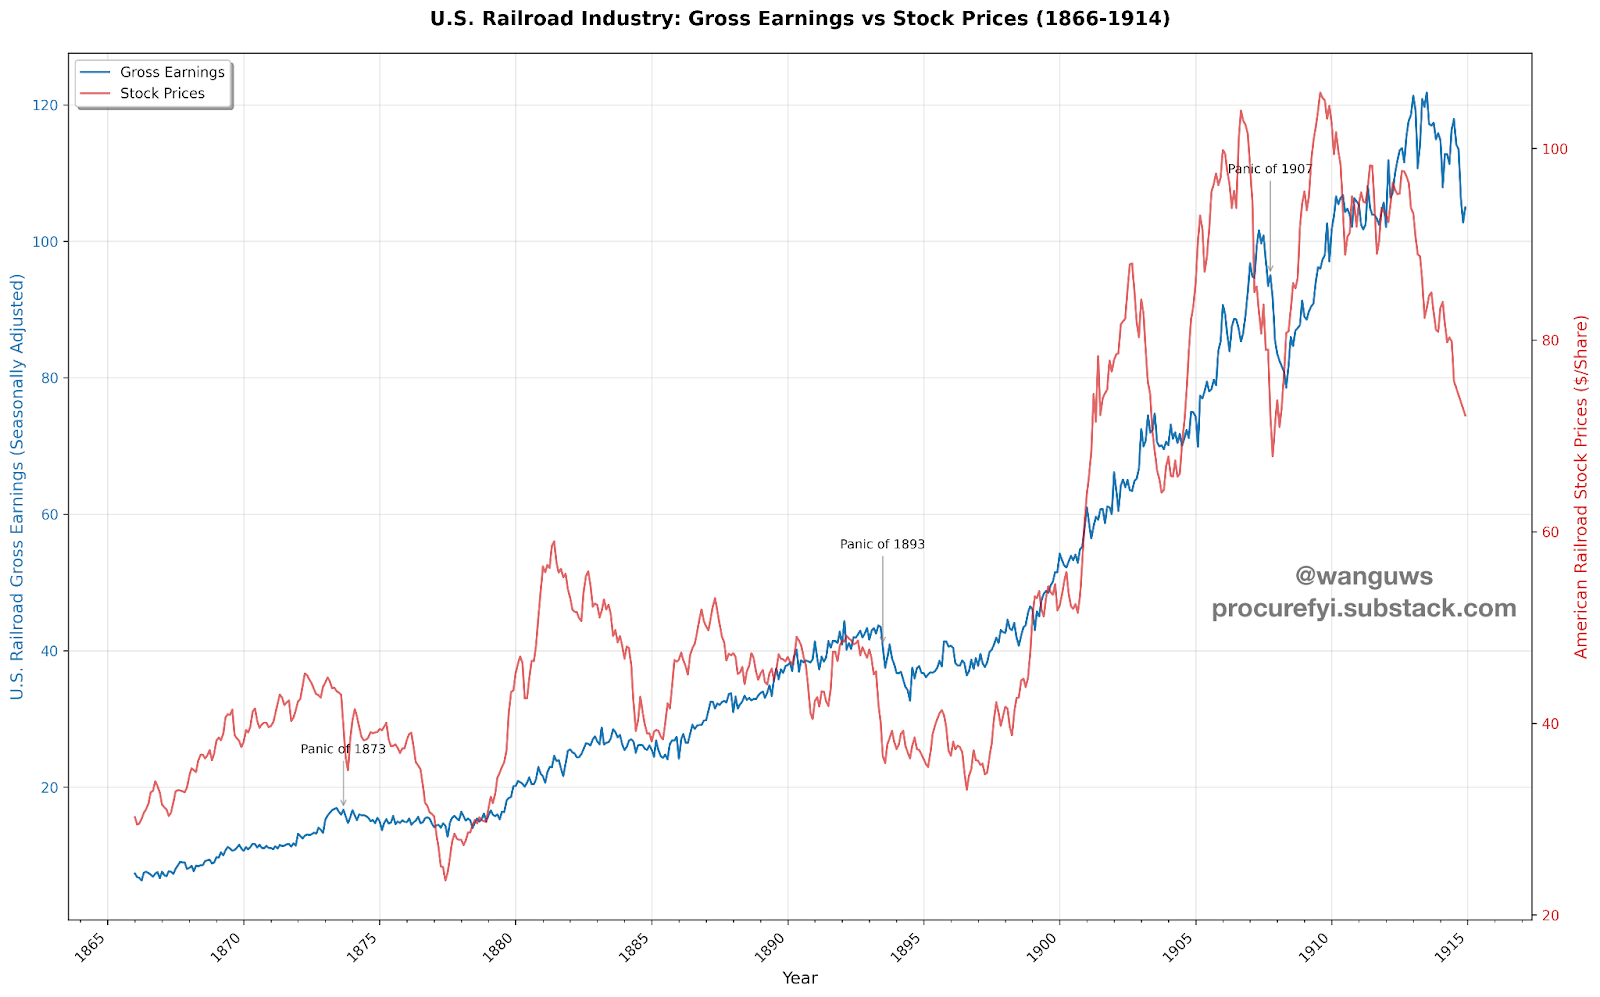
Railroads are where the “buy the future early” trade becomes industrialized. The asset becomes a map. The position becomes an obligation. Optimism, quietly, becomes a funding plan. When the marginal lender blinks, the unwind doesn’t need a scandal. It just needs the next cash call to arrive after refinancing disappears.
V. Pyramids of Control: Utilities, 1924 - 1932
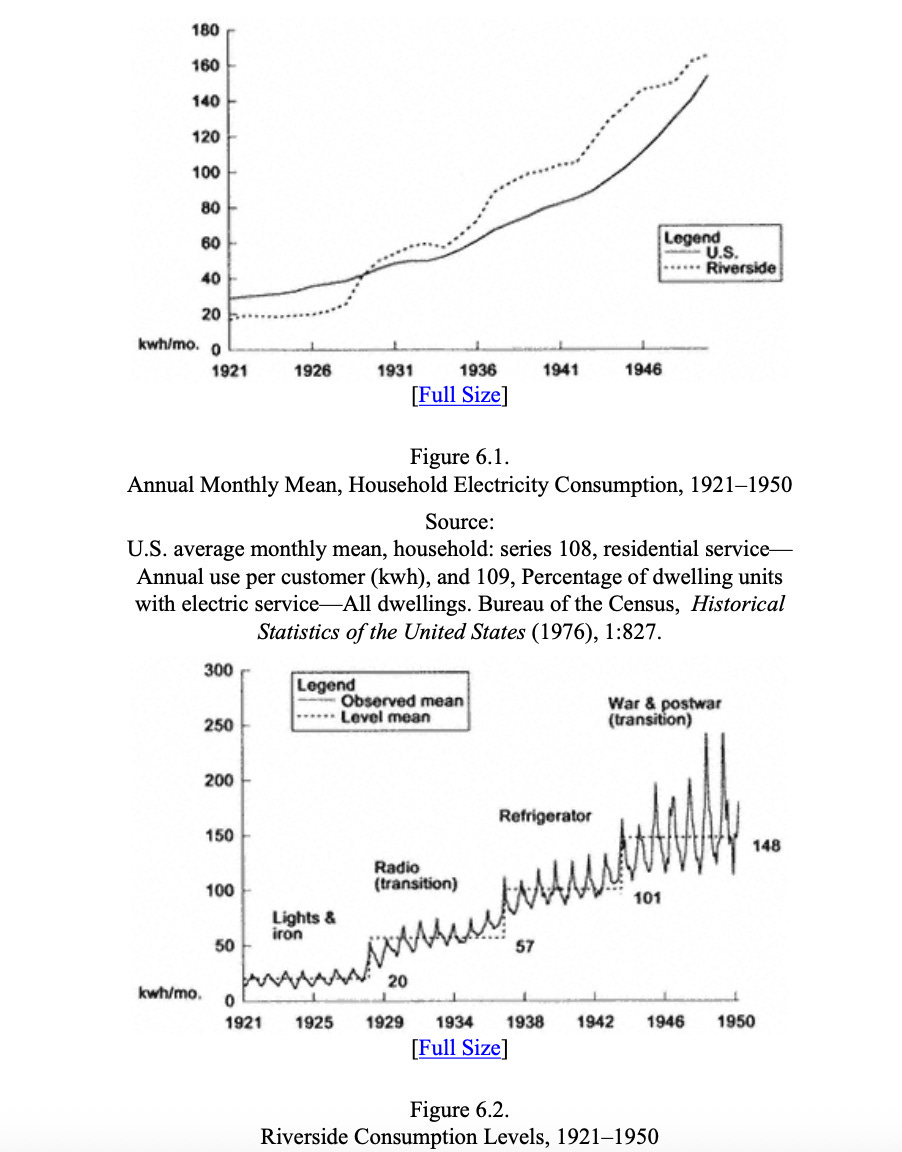
Everyone could see where electrification was going. Every home lit, every factory humming. But the path there stretched across decades. U.S. generating capacity nearly doubled between 1922 and 1930, yet as late as 1935, only 10 percent of American farms were electrified. The technology was spreading. The country was still early in the physical rollout.
The 1920s compressed that long engineering curve into a short capital-markets event. What turned stability into a boom wasn’t optimism alone. It was financial engineering.
Wall Street’s instrument was the public-utility holding company. Instead of buying the regulated utility itself, investors bought equity in companies that owned utilities. Those holding companies could issue bonds, preferred stock, and common stock to acquire additional utility securities, which in turn supported further issuance. Layered repeatedly, this produced pyramiding: control flowed upward through thin equity slices while leverage accumulated throughout the structure. Operating utilities were regulated. Holding companies often were not.
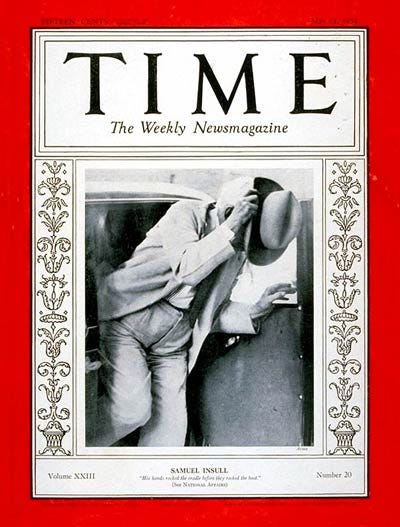
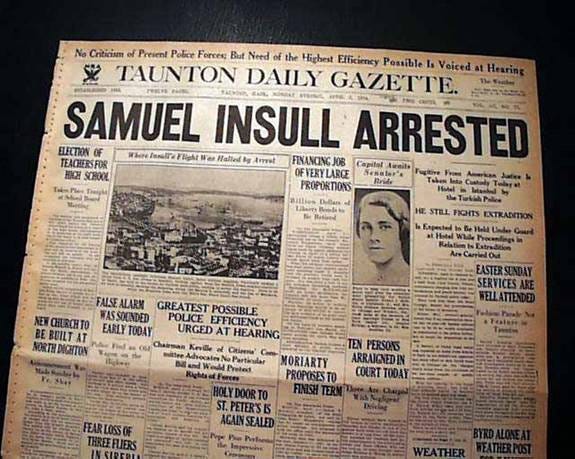
Samuel Insull became the emblem of this architecture because of its scale. By 1930, roughly $27 million of capital at the top controlled more than $500 million of underlying assets. The arrangement appeared resilient as long as refinancing was easy and security prices held.
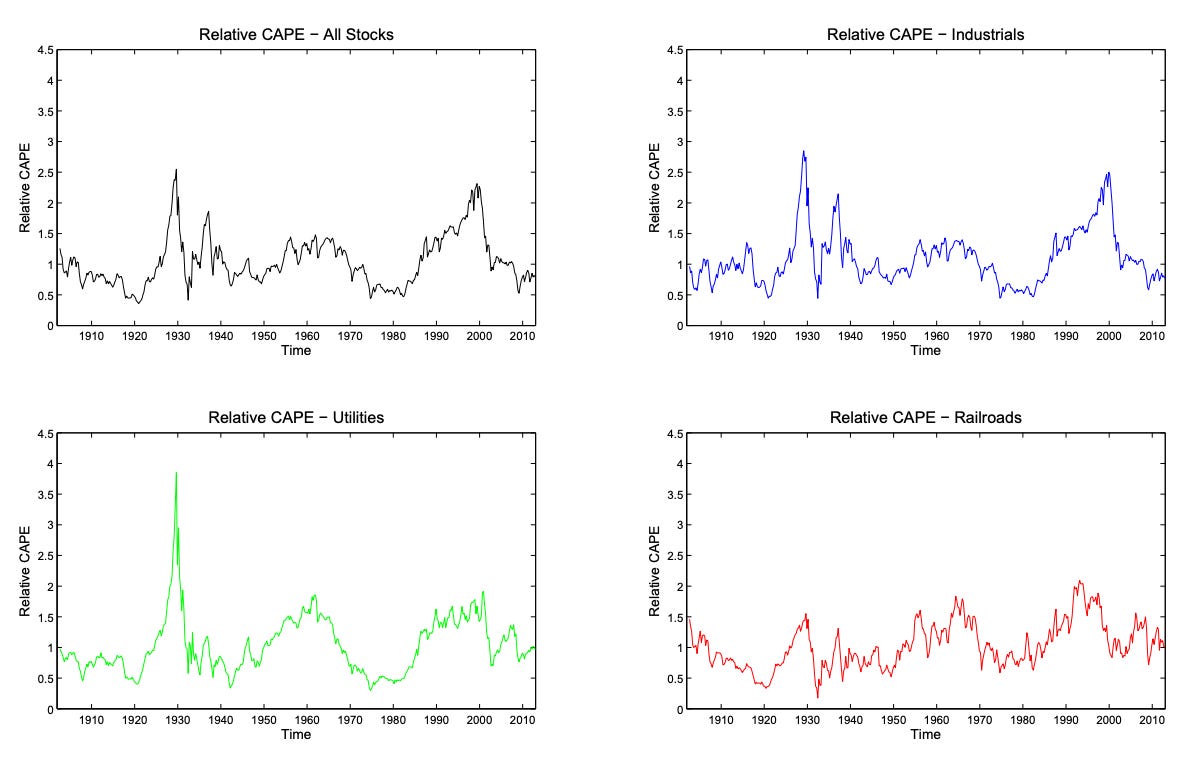
Valuations reflected how far this logic was carried. The utilities sector CAPE reached a record above 60 in Q3 1929. Barron’s warned that summer about unrestrained speculation and an accelerating merger wave that far outpaced underlying economics.
When the system unwound, it did so through financing rather than technology. After the 1929 crash, credit conditions tightened and the market for new issues weakened. Insull’s control rested on pledged stock. Falling prices meant declining collateral values, which triggered margin pressure, forced sales, and challenges to control itself. The market price of utility securities stopped functioning as a measure of optimism and became an operational constraint. It determined whether debt could be rolled, obligations met, and control maintained.
Once that mechanism flipped, the unwind was nonlinear. Between Q3 1929 and Q2 1932, the utilities sector lost more than 75 percent of its real total return. Insull’s empire entered receivership in 1932, wiping out hundreds of thousands of shareholders and bondholders. The political response, the Public Utility Holding Company Act of 1935, codified the lesson by dismantling multi-tier holding companies and re-anchoring the sector to simpler, regulated balance sheets.
VI. Margin and Momentum: RCA, 1927 - 1932
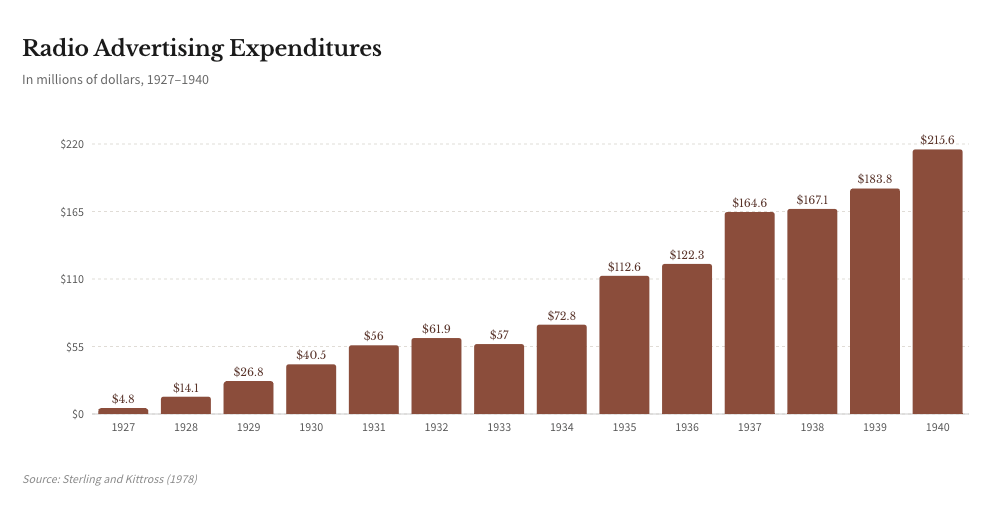
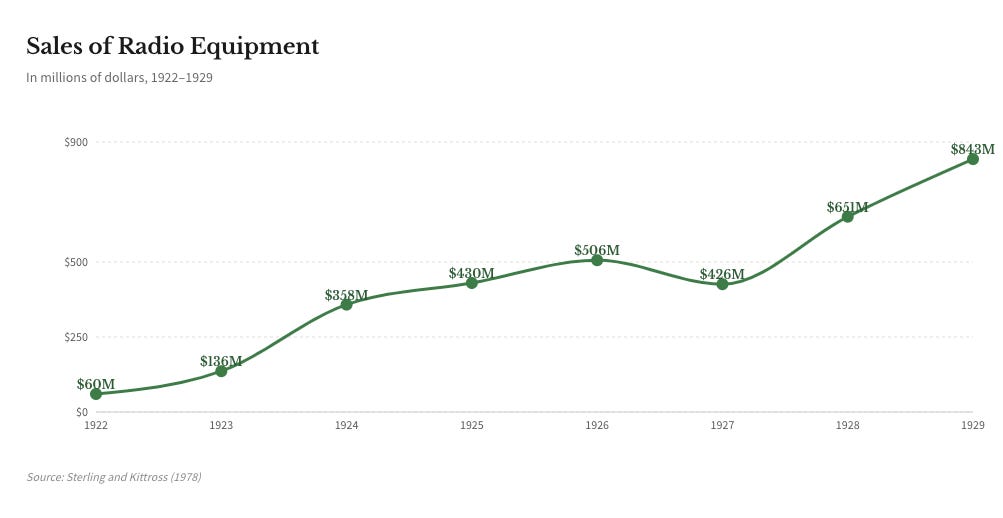
Radio was genuinely new. Adoption was compounding fast. The buildout required real capital: factories expanded, supply chains assembled, thousands of households wiring themselves into a new medium. Radio advertising was tiny in the late 1920s, then rose sharply. $4.8 million in 1927. $14.1 million in 1928. $26.8 million in 1929. By 1932, even after the crash, it hit $61.9 million and kept climbing into the late 1930s.
RCA became the stock that concentrated the whole story. It wasn’t just a radio company. It sat on the industry’s choke points: patents, licensing, the network economics of broadcasting. Investors love a gatekeeper because it makes the end state feel simpler. You don’t have to pick the winning set manufacturer or the winning station. You buy the tollbooth.
Then came the credit pathway. The late-1920s market made it easy to own growth with borrowed money. Investors bought shares with a partial cash down payment and borrowed the rest through brokers, funded by a swelling pool of call loans and short-term credit. Broker loans tied to carrying securities rose from $4.4 billion in January 1928 to $8.5 billion by October 1929. That structure does two things. It amplifies the upside on the way up. It turns a price decline into forced selling on the way down.
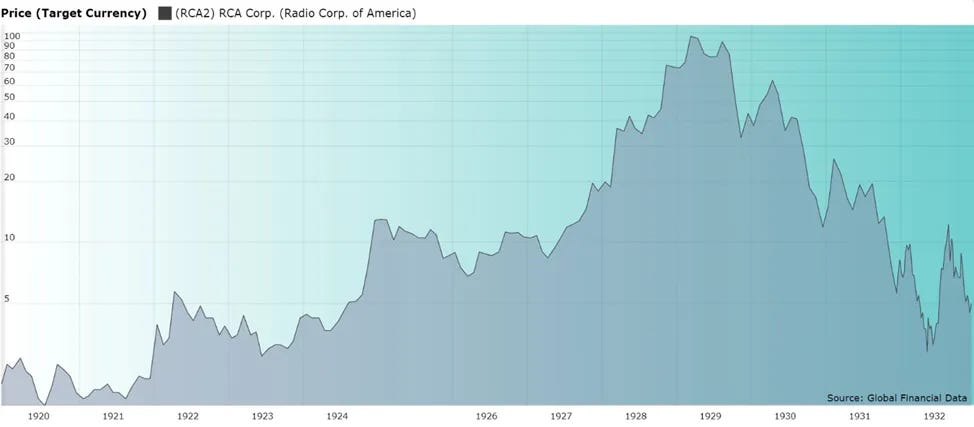
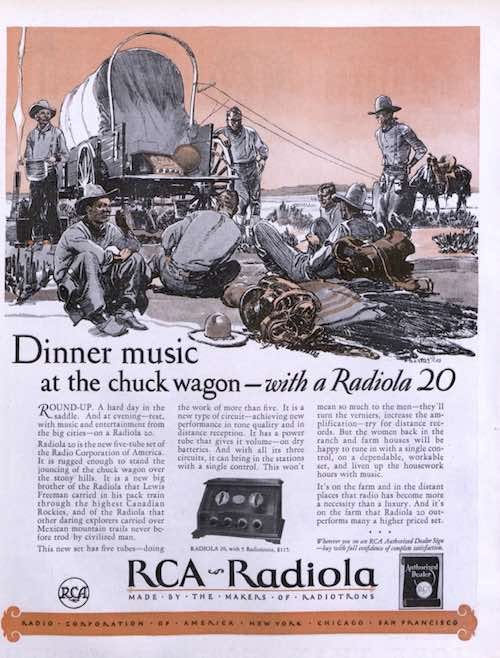
RCA, split-adjusted, traded around $5 in 1922. It hit $113 in 1929. By 1932 it was back to $2.50. A 98 percent collapse.
The radios still worked. Advertising dollars kept rising. But once prices started falling, collateral fell with them. Brokers pulled back. Margin turned from accelerant into trap. The stock had been priced for perfection and financed for momentum. Once the financing window narrowed, the market stopped paying end-state prices for medium-term progress.
VII. Demand on Credit: Internet, 1995 - 2002
The internet boom had margin debt too. But it also had something new: vendor financing disguised as revenue. By late 1999, the internet trade had crossed the threshold that matters in every mania: the end state became legible. You could picture it. Shopping moved online. Advertising followed eyeballs. Every company needed a website, then e-commerce, then infrastructure. The promise was visible in daily life and easily converted into a valuation story.
But the boom didn’t run on imagination alone. It ran on a credit pathway that let investors and companies pull future demand into the present.
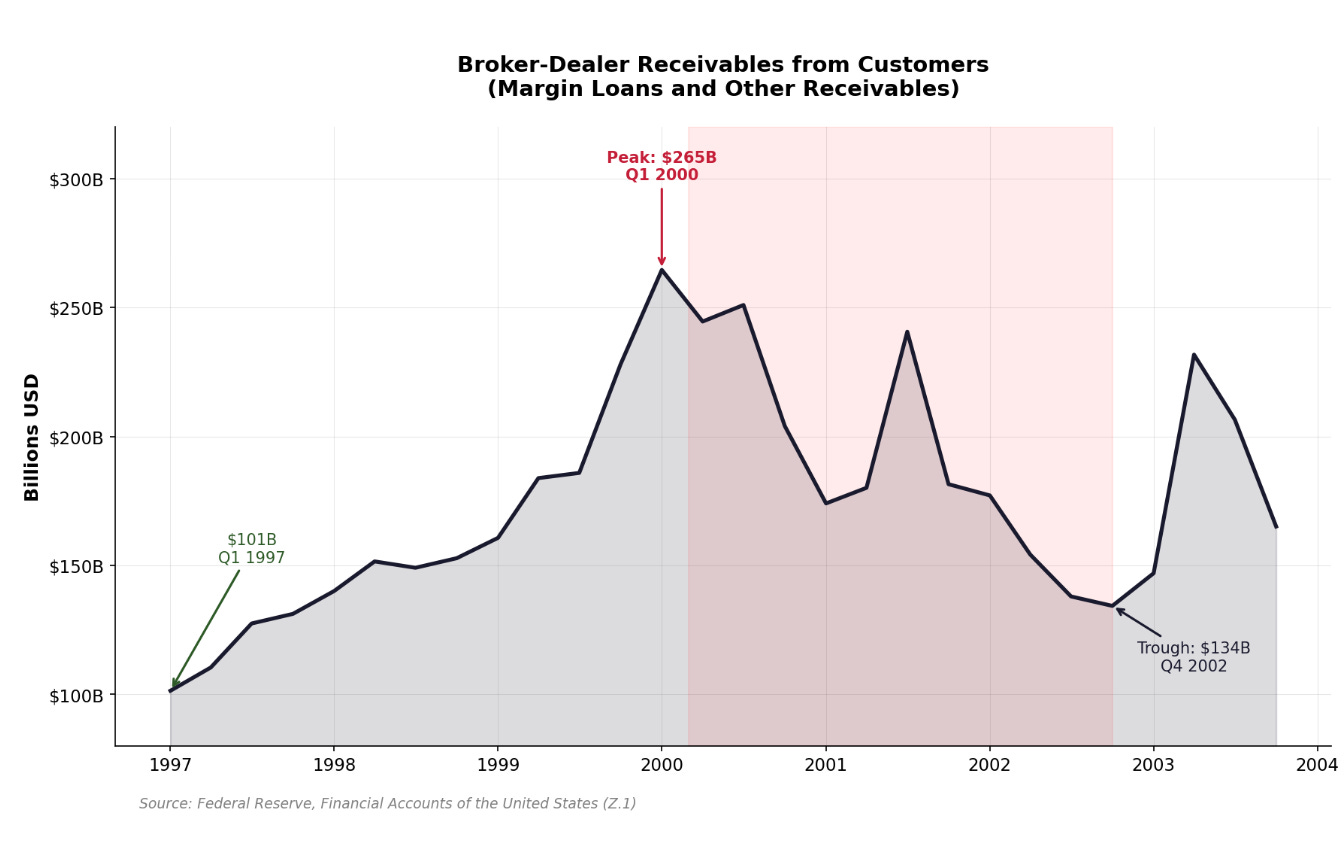
On the market side, the mechanism was leverage against rising prices. NYSE margin debt climbed from $100 billion in 1996 to $278 billion at the March 2000 peak. Nearly tripled. Investors controlled large positions with small cash down. Brokers financed the rest.
The IPO market functioned as a credit window with a stock-exchange wrapper: public capital for companies that couldn’t have borrowed a dime, available until the day it wasn’t. In 1999 alone, 477 companies went public, raising $69 billion, many at valuations that assumed a decade of growth. When the window closed, it closed fast. 2001 saw fewer than 80 deals.
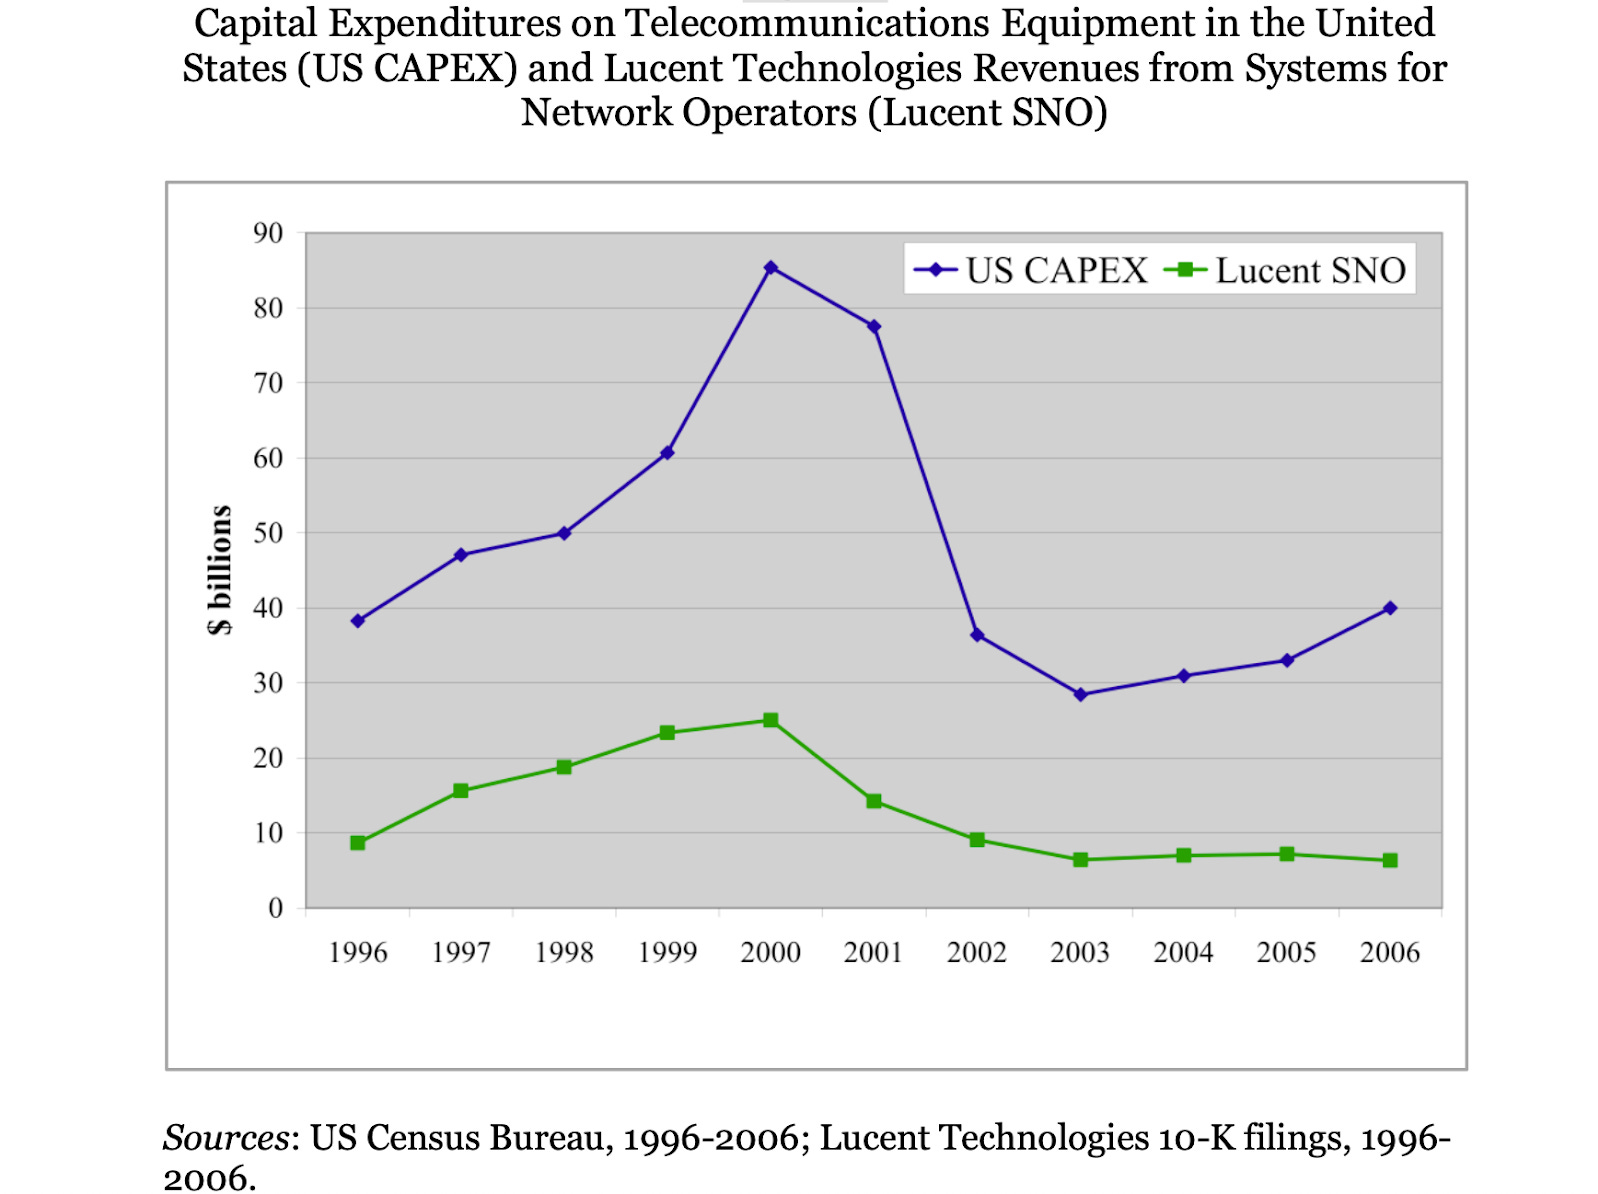
On the real-economy side, the buildout was capital-intensive and funded like a boom. Telecom capex grew at a 23 percent compound annual rate from 1995 to 2000, fueled by high-yield debt. Global Crossing. 360networks. Williams. They loaded up on junk bonds against incomplete buildouts, betting the new-issue window would stay open long enough to reach breakeven.
It didn’t. When credit spreads widened in 2000, forty-seven telecom startups went bankrupt within three years. The technology still worked. The financing didn’t.
Then there was vendor financing. This is the part that gets forgotten.
Lucent opened a $2 billion credit line for WinStar in 1998, booking revenue while quietly becoming WinStar’s lender. By fiscal 2000, Lucent had committed $8.1 billion in customer credit and guarantees. Nortel had extended $3.1 billion. Cisco, $2.4 billion. The equipment makers had become shadow banks, lending customers the money to buy their own products.
When Lucent refused WinStar an additional $90 million in early 2001, WinStar went bankrupt. Lucent wrote off $700 million. Multiply that across the industry.
At the top, equity became acquisition currency. Cisco did 23 deals in 1999 and 2000, almost all in stock. JDS Uniphase bought SDL for $41 billion in shares at the absolute peak, then wrote off $50 billion within a year.
So what broke in 2000 - 2002 wasn’t one earnings miss or one fraud. It was the financing stack: high-yield debt, vendor credit, the IPO window, stock-as-currency. That stack had underwritten the pace of the buildout and the willingness to price distant demand as near-term reality.
The proximate trigger was the Fed. Greenspan raised rates six times between June 1999 and May 2000, from 4.75 percent to 6.5 percent. But rate hikes alone don’t collapse a system. What collapses a system is a structure that requires perpetual confidence.
Stock prices fall. Collateral values fall. Margin calls force selling. Prices fall further. Credit ratings get cut. Debt markets close. Companies issue dilutive equity at the worst moment. One borrower defaults. Lenders reprice the whole sector. Spreads widen. More borrowers default.
The loop is reflexive. One wobble in a tight enough structure and the whole thing unwinds. Once that architecture cracked, projects got canceled, inventories piled up, and capex that had compounded at 23 percent annually fell at 28 percent for three years.
Same Plumbing, Different Century
Every boom in this essay follows the same sequence. A technology arrives whose end state is easy to picture: a continent connected by rail, every home electrified, commerce rewired by the internet. That clarity is the first ingredient. The second is a financing regime that lets you own the future now. When a vivid future meets cheap credit, markets don’t wait for a 40-year diffusion curve. They compress it into three to five years of price action.
Early on, the fundamentals feel decisive: adoption metrics, earnings revisions, technical milestones. The market is building a story, and the evidence keeps arriving on schedule. But three or four years in, once the financing stack is fully extended, the question quietly changes. The market stops asking, “Is this working?” and starts asking, “Can this still be financed?” At that point, everyone with exposure becomes a salesman, because the structure needs belief to remain liquid.
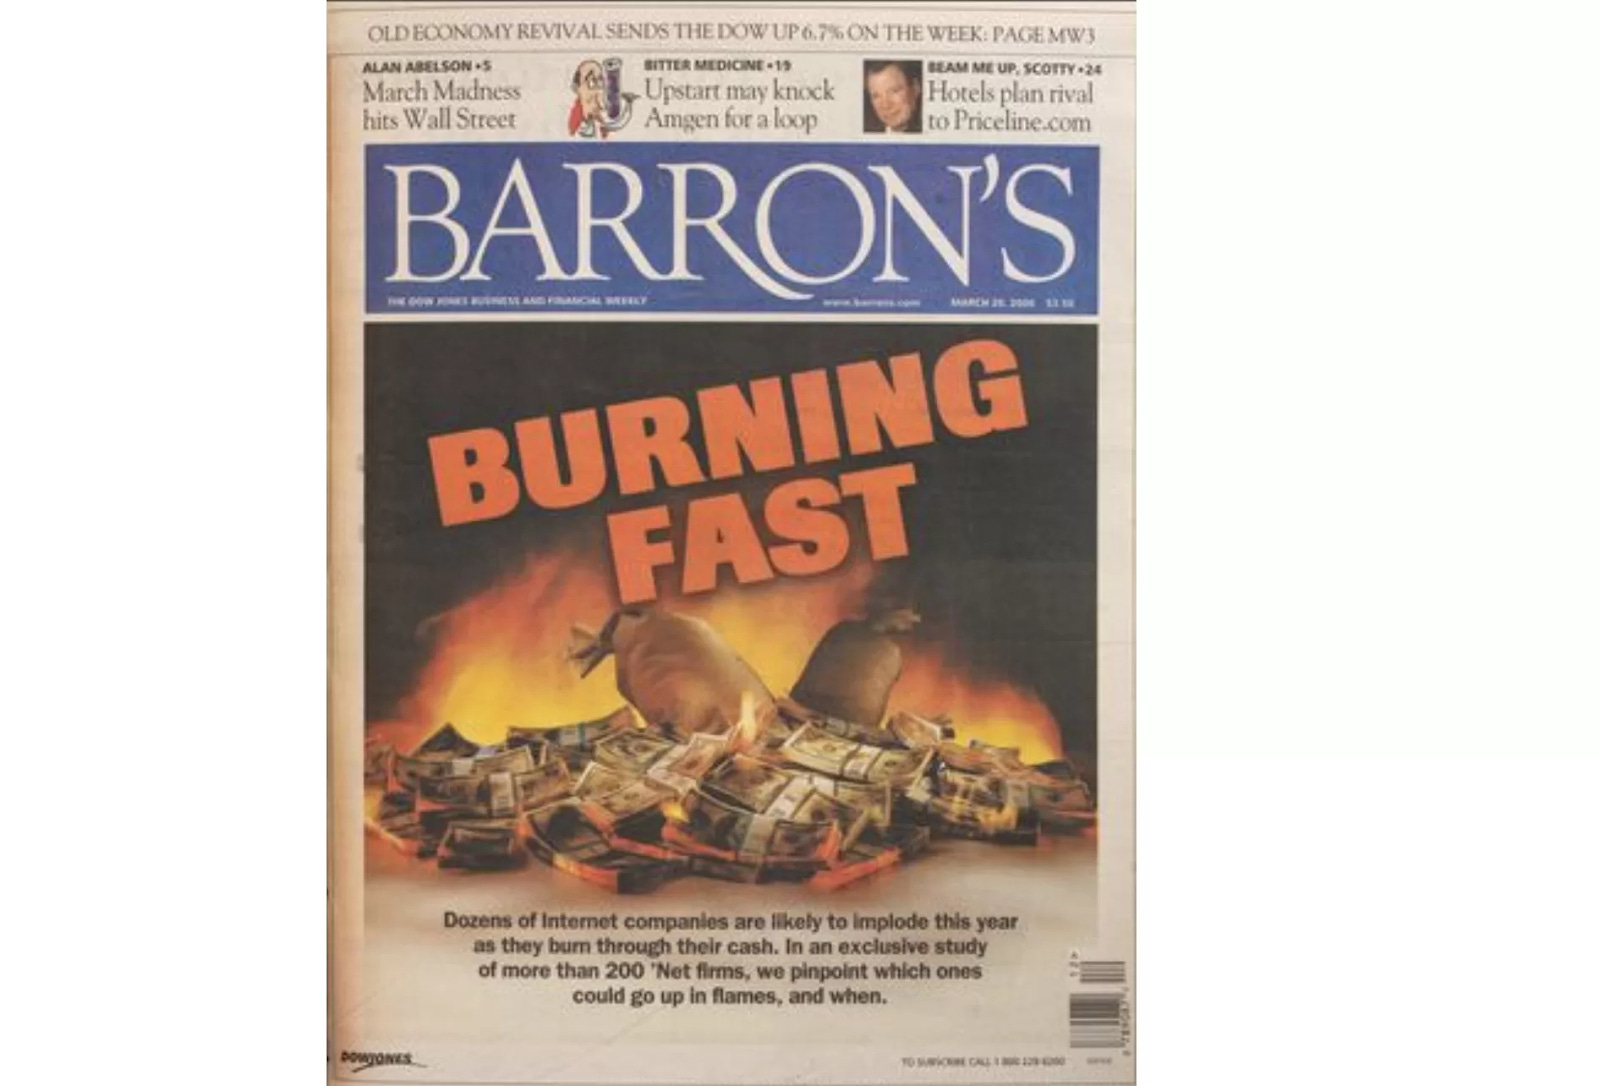
Then sentiment cracks. It rarely takes much: a rate hike, a missed quarter, a magazine cover that does the math, a single default that forces lenders to reprice an entire sector. The trigger can be small: credit tightens, refinancing stops, and the bridge to the future can’t be funded anymore. The technology keeps working, but the market stops financing the optimism.
The people who underwrote railroad bonds and bought RCA at the top were usually right about the direction of history. So was Meriwether Lewis. The future they believed in arrived. It just didn’t arrive on the timeline their leverage demanded. So the question in any boom isn’t whether the technology is transformational. It usually is. The question is whether you’re still in the phase where that matters.
You can decide where we are now.
Appendix: Financing Mechanisms and Catalysts
Stylized summary: dominant financing channel, representative catalyst, and failure mode. Dates are approximate and meant to capture the moment the refinancing window narrowed.